
Clusters#
Find clusters in distributions of phasor coordinates.
The phasorpy.cluster module provides functions to automatically
find clusters in phasor coordinates, either by fitting ellipses using a
Gaussian mixture model, or by assigning every phasor coordinate to a cluster
using k-means clustering.
Import required modules, functions, and classes:
import numpy

from phasorpy.cluster import phasor_cluster_gmm, phasor_cluster_kmeans
from phasorpy.phasor import phasor_center
from phasorpy.plot import PhasorPlot
Synthetic phasor coordinates#
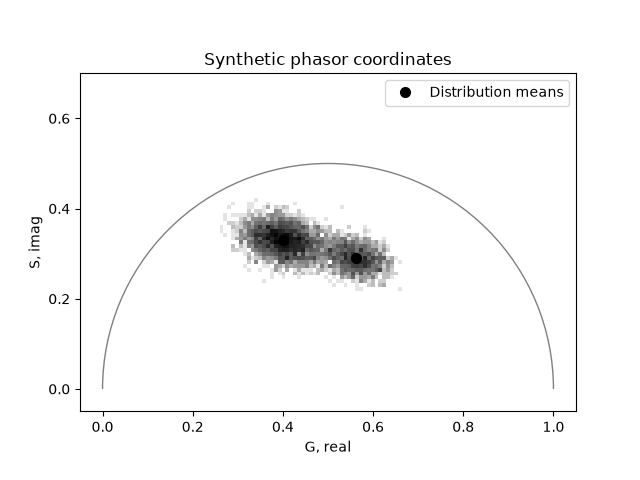
Create a synthetic distribution of phasor coordinates containing two partially overlapping clusters of different size and shape. The second cluster is twenty times brighter than the first:
rng = numpy.random.default_rng(42)

real1, imag1 = rng.multivariate_normal(
    [0.40, 0.33], [[2.4e-3, -4.0e-4], [-4.0e-4, 9.0e-4]], 4000
).T
real2, imag2 = rng.multivariate_normal(
    [0.56, 0.29], [[1.8e-3, -3.0e-4], [-3.0e-4, 7.0e-4]], 2000
).T

real = numpy.concatenate([real1, real2])
imag = numpy.concatenate([imag1, imag2])
mean = numpy.concatenate(
    [rng.normal(10.0, 2.0, 4000), rng.normal(200.0, 40.0, 2000)]
)
Plot the distribution as a two-dimensional histogram, together with the mean coordinates of the two distributions for reference:
plot = PhasorPlot(title='Synthetic phasor coordinates')
plot.hist2d(real, imag, cmap='Greys')
plot.plot(
    [real1.mean(), real2.mean()],
    [imag1.mean(), imag2.mean()],
    'o',
    color='k',
    markersize=7,
    label='Distribution means',
)
plot.show()
Gaussian mixture model#
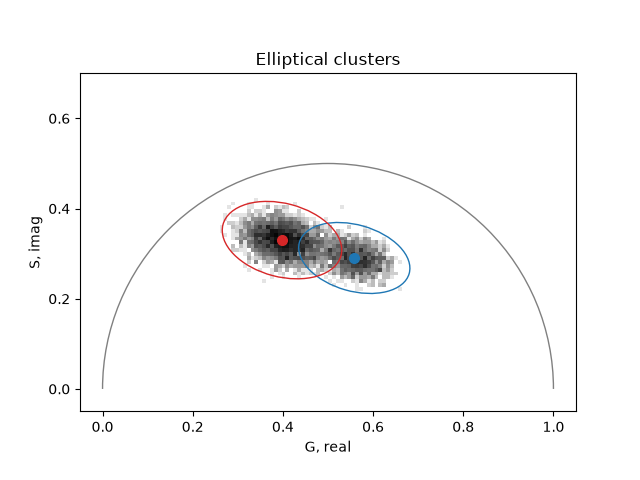
The phasorpy.cluster.phasor_cluster_gmm() function fits a Gaussian
mixture model to the phasor coordinates and returns the parameters of
ellipses describing the clusters:
gmm_real, gmm_imag, radius, radius_minor, angle = phasor_cluster_gmm(
    real, imag, clusters=2, random_state=42
)

print(f'centers: {gmm_real[0]:.3f}, {gmm_imag[0]:.3f}')
print(f'         {gmm_real[1]:.3f}, {gmm_imag[1]:.3f}')
centers: 0.558, 0.290
         0.398, 0.330
Both clustering functions start from a random initialization. Arguments
such as random_state are passed to the underlying scikit-learn
estimators and are used throughout this tutorial to obtain reproducible
results.
The ellipses have the same parameters as elliptical cursors and can be
plotted with phasorpy.plot.PhasorPlot.cursor():
plot = PhasorPlot(title='Elliptical clusters')
plot.hist2d(real, imag, cmap='Greys')
plot.cursor(
    gmm_real,
    gmm_imag,
    radius=radius,
    radius_minor=radius_minor,
    angle=angle,
    color=['tab:blue', 'tab:red'],
)
for re, im, color in zip(
    gmm_real, gmm_imag, ('tab:blue', 'tab:red'), strict=True
):
    plot.plot(re, im, 'o', color=color, markersize=7)
plot.show()
K-means clustering#
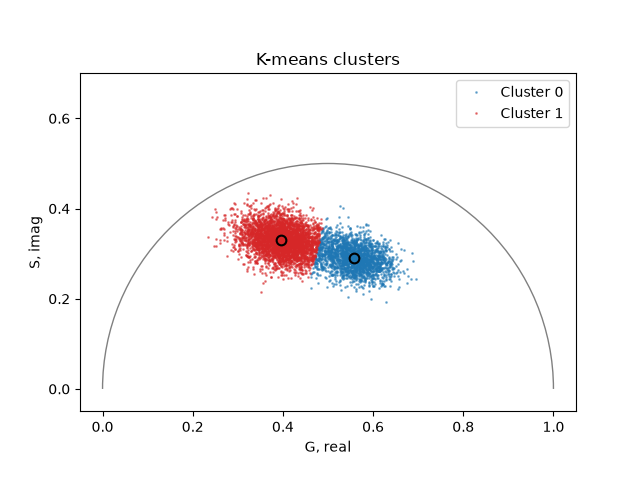
Instead of describing clusters by ellipses, the
phasorpy.cluster.phasor_cluster_kmeans() function partitions the
phasor coordinates into a fixed number of clusters, assigning each phasor
coordinate to the cluster with the nearest center:
center_real, center_imag, labels = phasor_cluster_kmeans(
    real, imag, clusters=2, random_state=42
)
The returned labels array has the same shape as the phasor coordinates
and contains the index of the cluster each coordinate belongs to.
Use it to plot the phasor coordinates in the color of their cluster:
plot = PhasorPlot(title='K-means clusters')
for index, color in enumerate(('tab:blue', 'tab:red')):
    plot.plot(
        real[labels == index],
        imag[labels == index],
        color=color,
        markersize=1,
        alpha=0.5,
        label=f'Cluster {index}',
    )
    plot.plot(
        center_real[index],
        center_imag[index],
        'o',
        color=color,
        markeredgecolor='k',
        markeredgewidth=1.5,
        markersize=7,
    )
plot.show()
Phasor coordinates that are NaN, for example, after filtering with
phasorpy.filter.phasor_threshold(), are not assigned to any
cluster and are labeled -1:
print(
    phasor_cluster_kmeans(
        [0.56, numpy.nan, 0.40], [0.29, 0.20, 0.33], clusters=2
    )[2]
)
[ 0 -1 1]
Intensity-weighted centers#
The cluster centers returned by both functions are unweighted. To obtain
intensity-weighted centers, apply
phasorpy.phasor.phasor_center() to the coordinates of each
cluster:
for index in range(2):
    weighted = phasor_center(
        mean[labels == index], real[labels == index], imag[labels == index]
    )
    print(f'cluster {index}')
    print(f'  unweighted: {center_real[index]:.3f}, {center_imag[index]:.3f}')
    print(f'  weighted:   {float(weighted[1]):.3f}, {float(weighted[2]):.3f}')
cluster 0
  unweighted: 0.557, 0.291
  weighted:   0.564, 0.289
cluster 1
  unweighted: 0.395, 0.331
  weighted:   0.407, 0.328
To weight the phasor coordinates during clustering, pass a
sample_weight argument to
phasorpy.cluster.phasor_cluster_kmeans().
Comparing the methods#
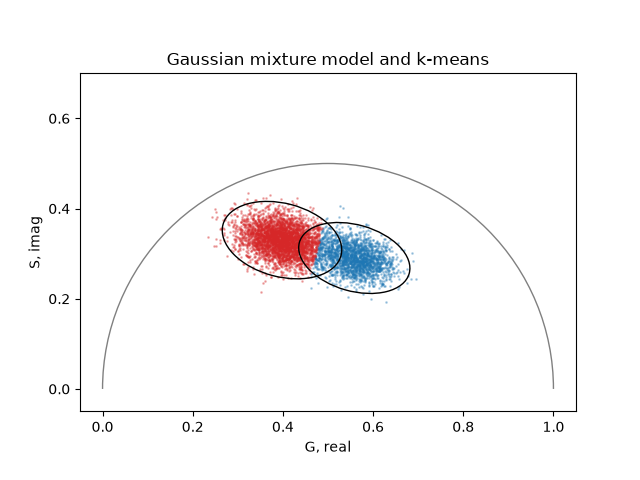
Both methods find the same two clusters, but describe them differently. The Gaussian mixture model returns ellipses, which may overlap and leave coordinates outside of any cluster, while k-means assigns every coordinate to exactly one cluster along a straight boundary:
plot = PhasorPlot(title='Gaussian mixture model and k-means')
for index, color in enumerate(('tab:blue', 'tab:red')):
    plot.plot(
        real[labels == index],
        imag[labels == index],
        color=color,
        markersize=1,
        alpha=0.3,
    )
plot.cursor(
    gmm_real,
    gmm_imag,
    radius=radius,
    radius_minor=radius_minor,
    angle=angle,
    color='k',
)
plot.show()
The clusters returned by both functions are sorted, by default by their
polar coordinates. Use the sort parameter to select another ordering,
for example, to keep cluster indices and colors consistent across datasets.
Total running time of the script: (0 minutes 0.211 seconds)